Separate axis labels in Stata

If you use separate axis, e.g. to plot two different lines in one twoway environment in Stata, you might need to use separate axis. In order to properly set distinct titles for either axis, you can use the following code

twoway ///
(lfit y1_var x_var, ytitle("y1_var title")) ///
(lfit y2_var x_var, yaxis(2) ytitle("y2_var title", axis(2))), ///
xtitle("X title")

where y1_var and y2_var are the values plotted on the y axes.

Add normal distribution to kernel density plot in Stata

This might be already implemented in the most recent version of Stata, but I just came across the problem that there seems to be no straightforward way to combine a kernel density plot (i.e. kdensity) with a normal distribution of the underlying variable.

Continue reading “Add normal distribution to kernel density plot in Stata”

Information about Stata macros: number of elements and order within locals and globals

Especially when running loops (see our posts here), it can be important to get more information about a macro, such as the length, or its first or last element.

Continue reading “Information about Stata macros: number of elements and order within locals and globals”

Useful string functions in Stata (updated list)

Most often when I search the internet for help on Stata, it is probably when I need to work with string variables (such as names). There are some very good summaries that cover aspects of string variables (e.g., this page). In this post –which will be continuously updated– we present random string functions that we think are extremely useful for Stata users.

Continue reading “Useful string functions in Stata (updated list)”

Format how locals are displayed in Stata

Often I use locals to calculate something (such as the mean of a variable for a specific group) and use this in a loop (say, over groups or over years). If you, for example, want to calculate the share of observations that belong to one group (say: female==1), you could simply write

Continue reading “Format how locals are displayed in Stata”

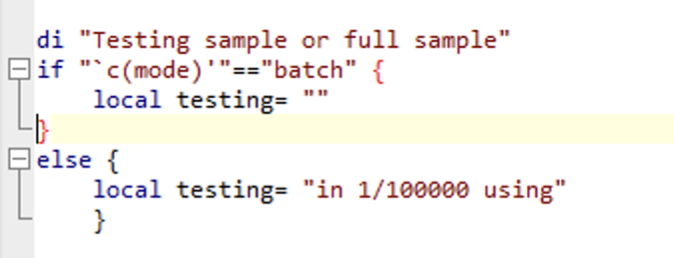
Piecewise execution of do-files in Stata

Do-files in Stata easily get a bit lengthy. Of course, you can try to shorten do-files and distribute code onto several do-files and have one master file that runs all of the respective sub-do-files (which are included by do dosubfile1.do). Alternatively, you can leave the do-file longish but write your code such that you only run parts of the code at once:

Continue reading “Piecewise execution of do-files in Stata”

Multiple lines commands in Stata

Many Stata commands get easily quite long. Take, for example, a command to generate a figure – possibly the layout definitions are quite lengthy and difficult to read. Stretching commands over several lines makes it much easier to write and read, and less prone to errors. 

Continue reading “Multiple lines commands in Stata”

Equation numbering in Microsoft Word

From time to time, I need to write articles in Microsoft Word. When I then also need to include Equations in the Word document, I realise (again) why I so much prefer to use LaTeX. Today I came across a simple way of having Equation numbering included in a word document (although it is natively not supported). Well, it is supported but only above or below a formula…

Continue reading “Equation numbering in Microsoft Word”