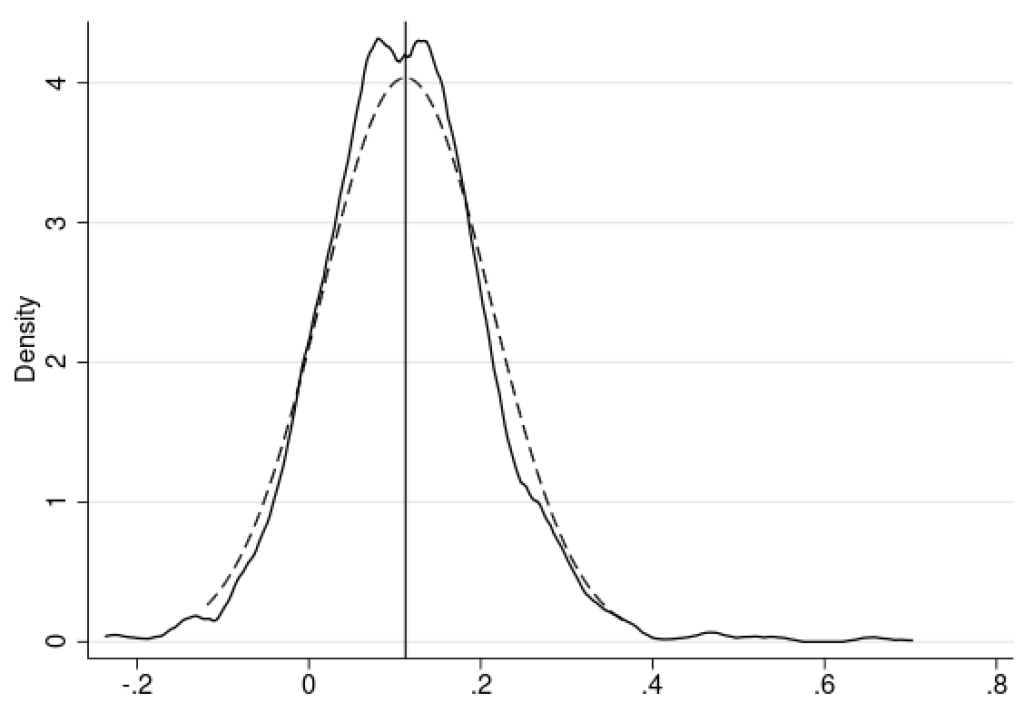
This might be already implemented in the most recent version of Stata, but I just came across the problem that there seems to be no straightforward way to combine a kernel density plot (i.e. kdensity) with a normal distribution of the underlying variable.
Of course, one option is to use
kdensity VARNAME, normal
where the option normal automatically adds the normal distribution. But then you are not able to use all the adjustments you know from the twoway plot environment. Thanks to Nick Cox (again!), there is a simple way around:
sum VARNAME, det
twoway ///
(kdensity VARNAME) ///
(function y=normalden(x, r(mean)',r(sd)'), range(r(p1)'r(p99)')) ///
, ///
graphregion(color(white)) ///
legend(off) ///
xline(`r(mean)') ///
xtitle("Variable name") ytitle("Density")

