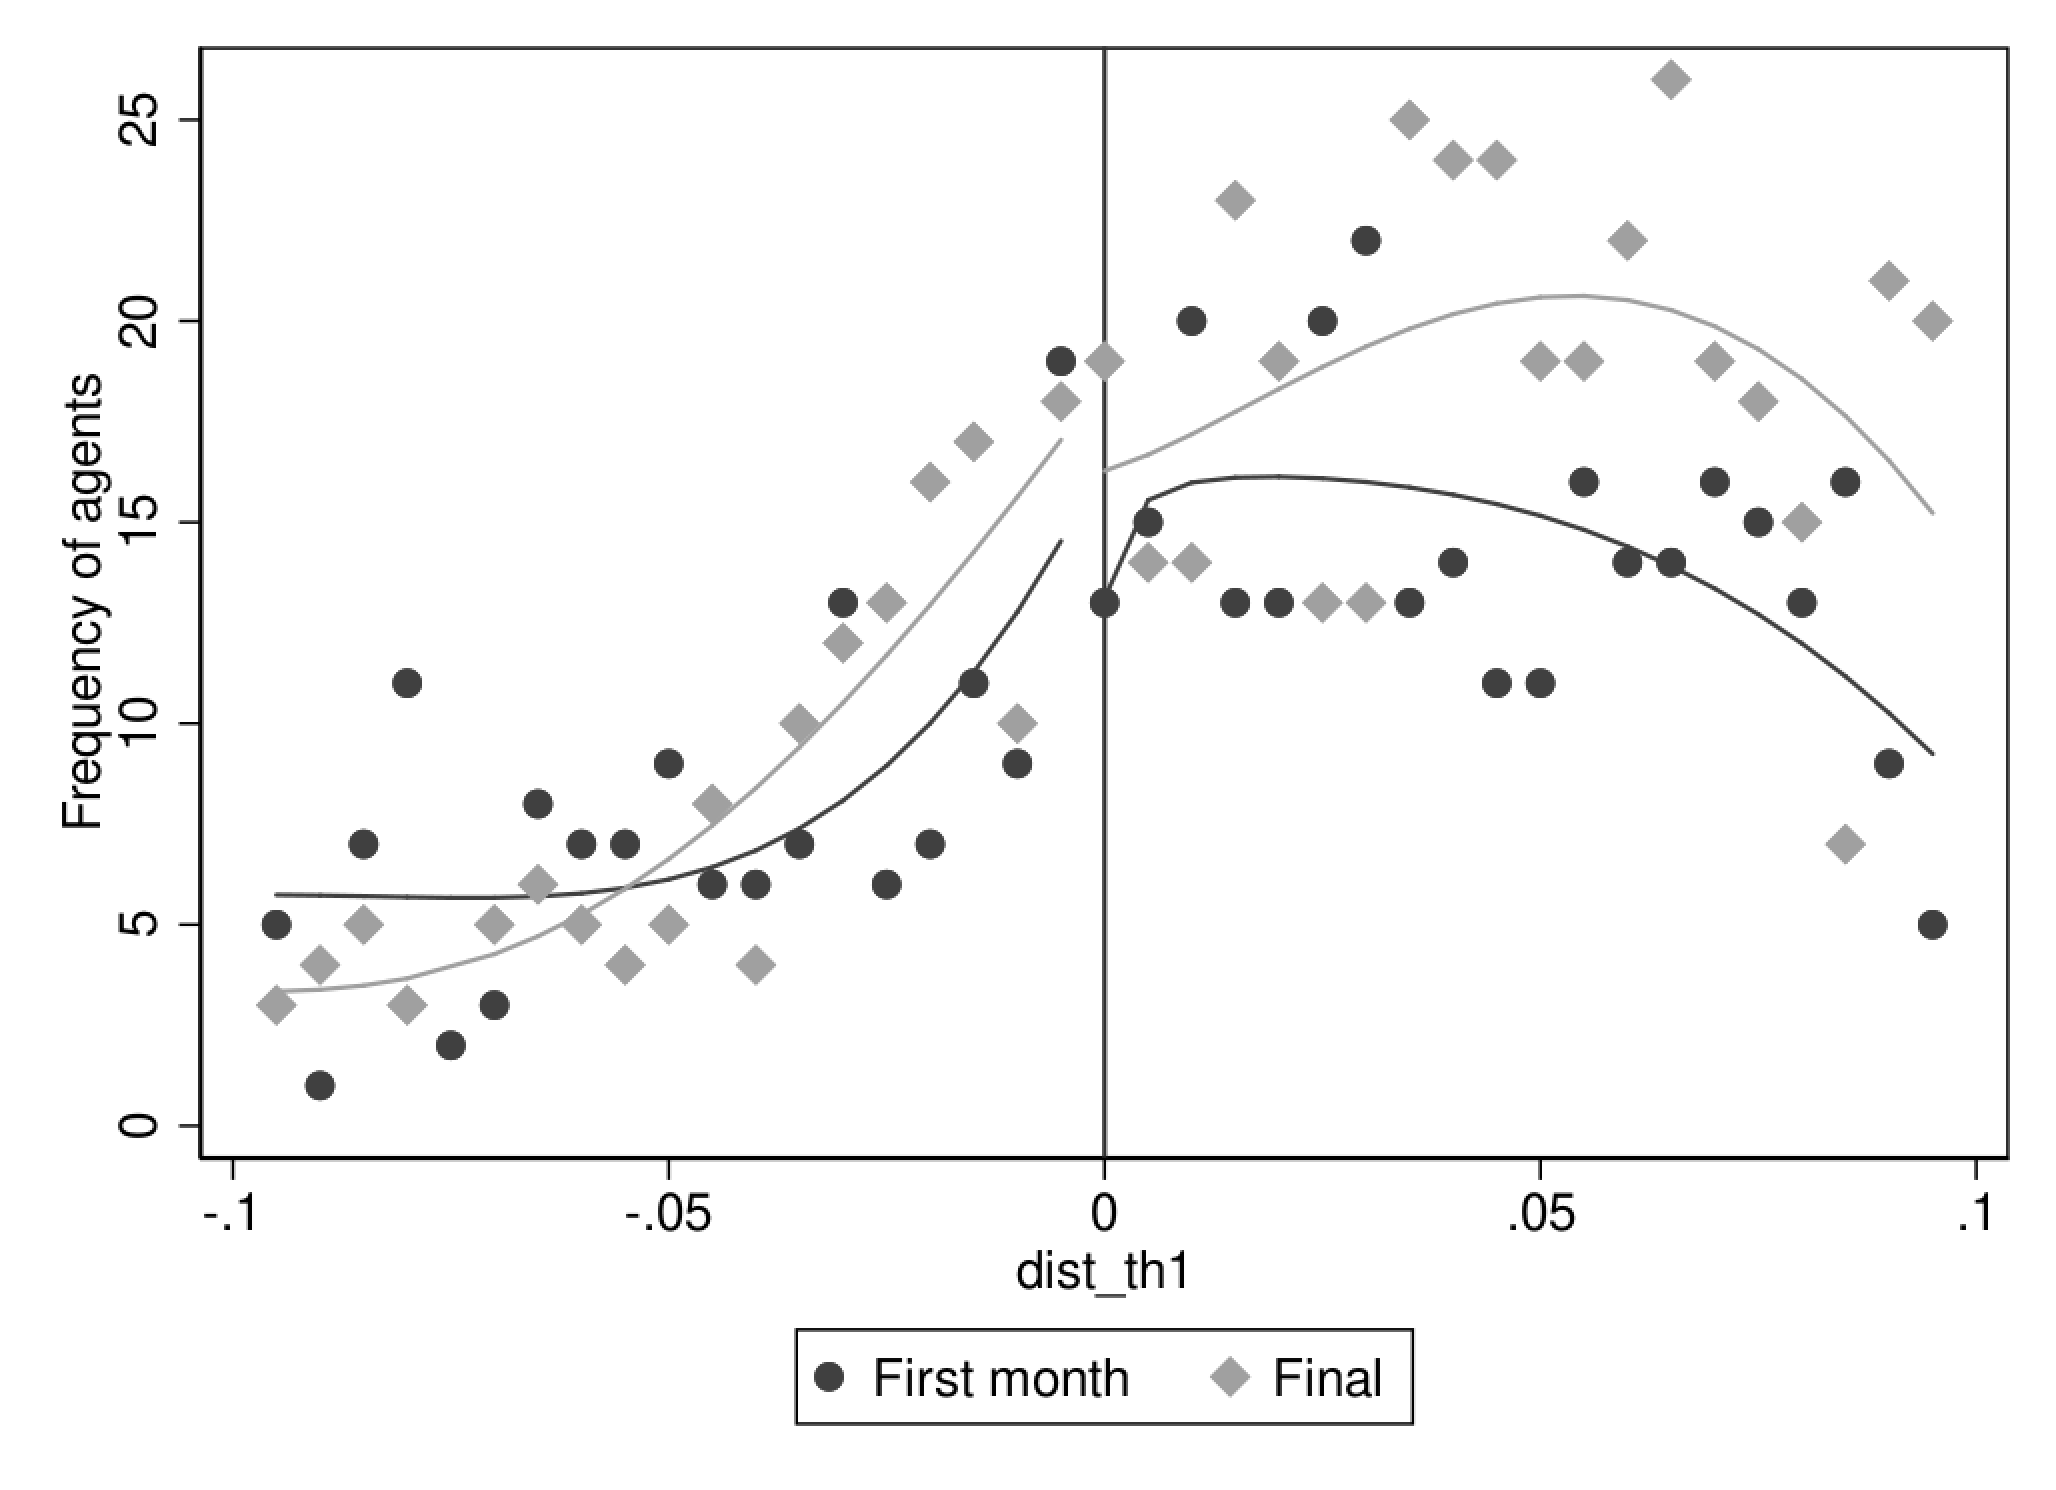
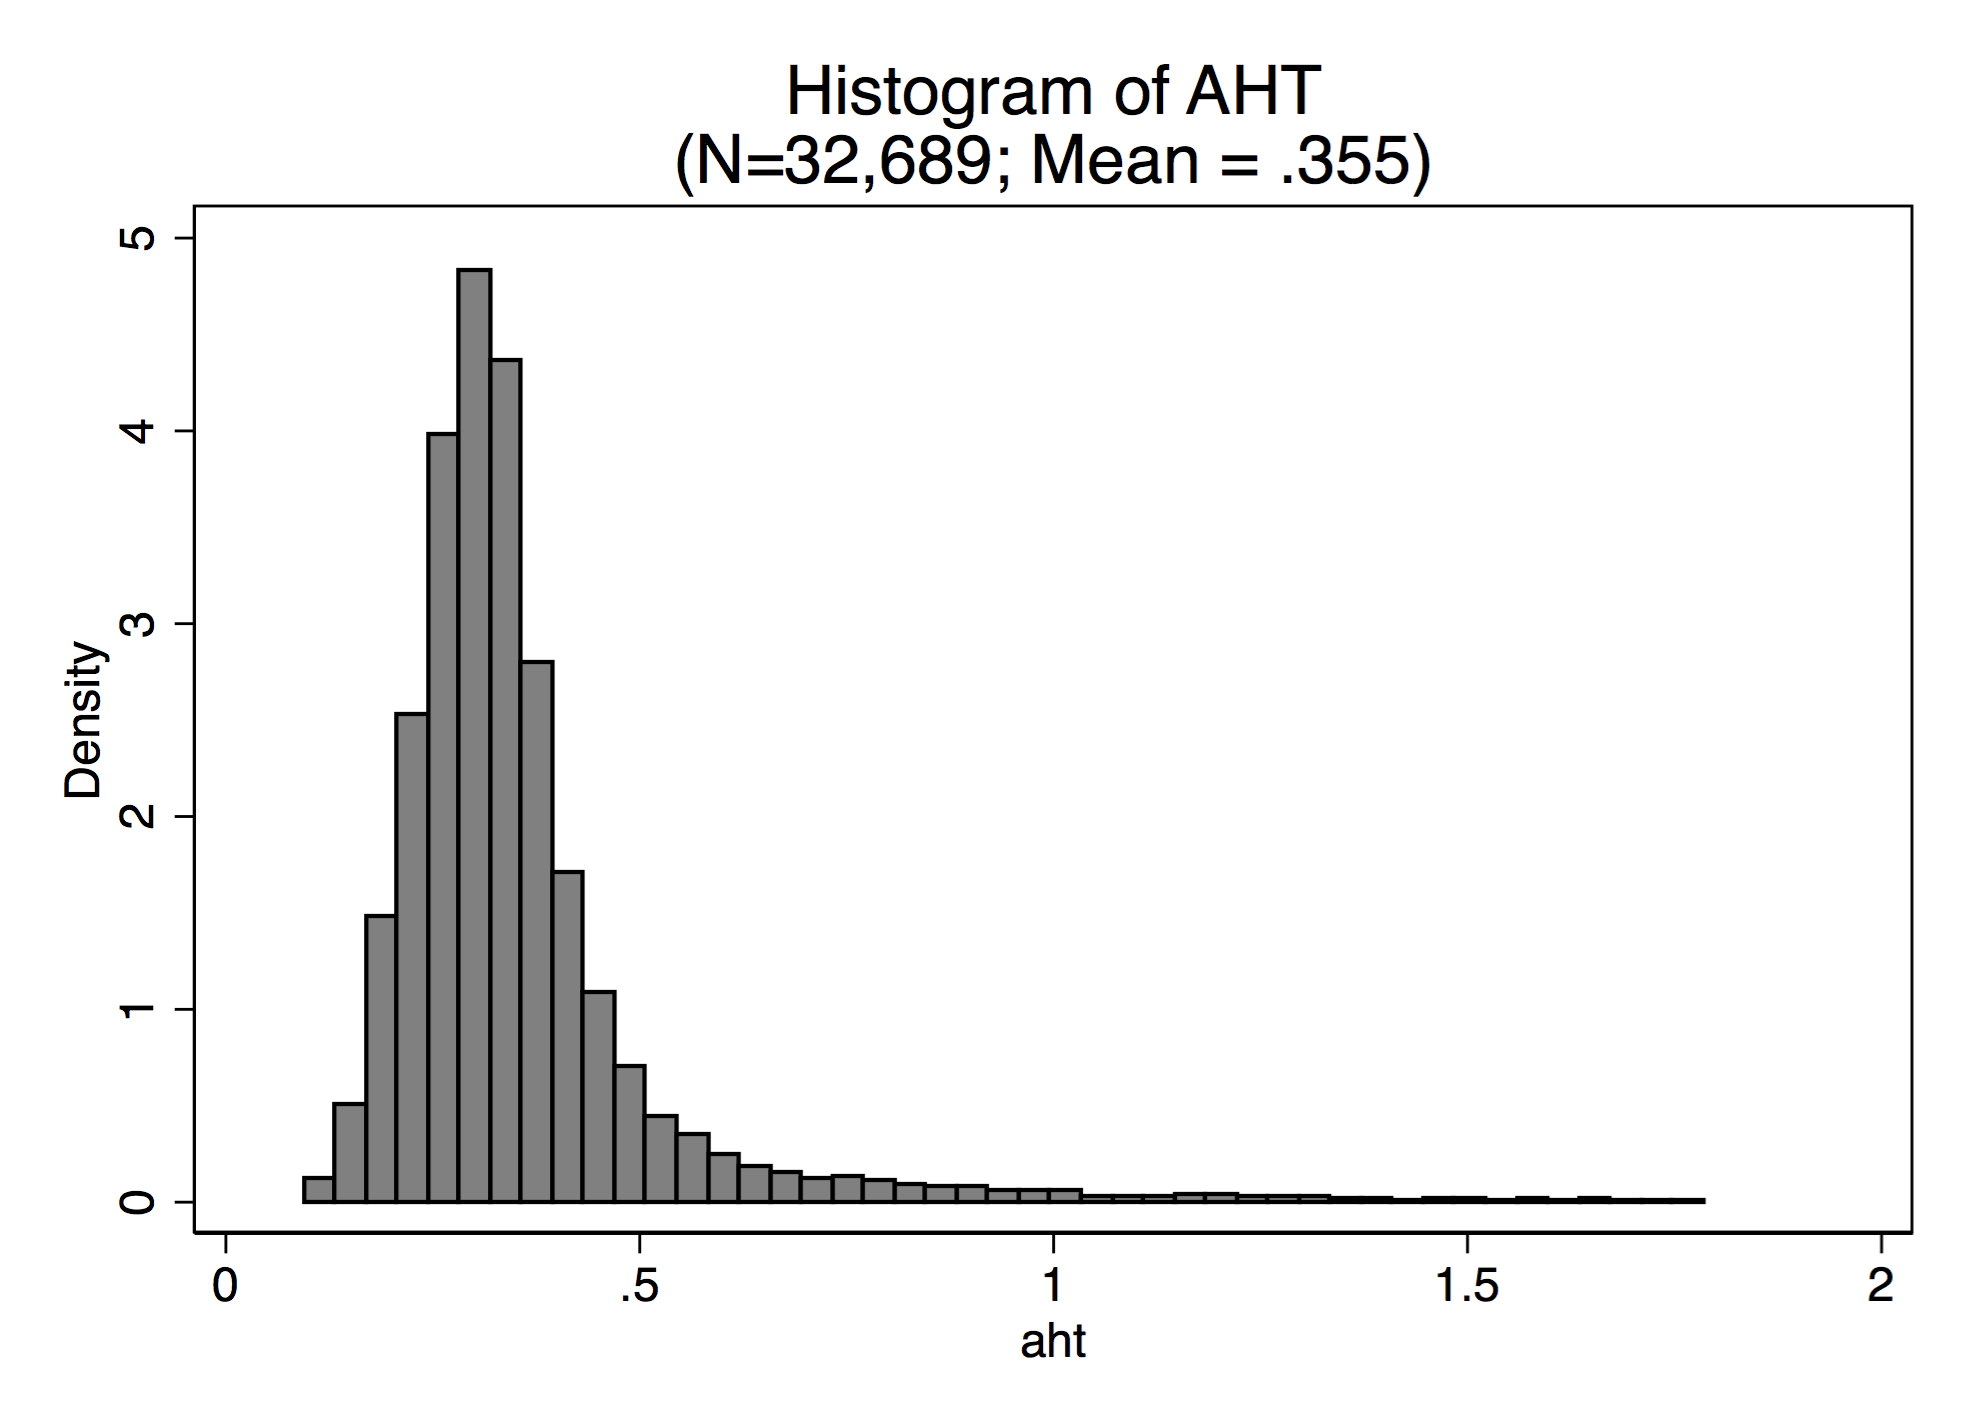
This might be already implemented in the most recent version of Stata, but I just came across the problem that there seems to be no straightforward way to combine a kernel density plot (i.e. kdensity) with a normal distribution of the underlying variable.
Continue reading “Add normal distribution to kernel density plot in Stata”Category: Stata – Figures
Supress labels in Stata figures
Supress legend elements in multiple Stata twoway figures
A great feature of Stata figures is that you can mix several plot types in one by using the twoway (...) (...) command. If you have several plots merged into one twoway graph and also want to add a legend, the legend might become a bit crowded. In the following example, legends are specified with the , legend(lab(1 "Scatter 1") lab (4 "Scatter 2")) option because I only wanted to mark the diamonds and circles in the legend:
Add time stamp to Stata figures
Especially in the early stages of a research project it might be good to “time stamp” figure so that you can later figure out when you created a certain figure. Of course you could just check the date in the explorer / finder, but you can also simply add a note to the figure with time and date of its creation:
Continue reading “Add time stamp to Stata figures”Returning percentiles as scalars
When I wanted to store percentiles in a local, e.g. to indicate the median in a figure, I used to first
Continue reading “Returning percentiles as scalars”Recover Stata code from .gph files
If you ever found a good looking Stata figure saved as Stata’s own .gph and wondered how this was produced, you can simply look up the code that is stored in the file’s meta data.
Formatting text in Stata figures
Simple formatting for text in Stata figures
This is not really new, but still comes in handy when formatting text in Stata figures. With a relatively simple code, you can make write text bold, in italics, and even greek letters.
Continue reading “Formatting text in Stata figures”Overlaying histograms in Stata
For analysing data and comparing distributions, I often want to overlay two histograms. Without further options, however, one distribution usually overlays the other and makes comparisons cumbersome. It is possible to set a few options to make the figure look nice. Continue reading “Overlaying histograms in Stata”
Formatted numbers in figure (sub)headers
There is a very nice and simple trick to include numbers (such as: number of observations, R2s or any other number that can be saved to a local) in Stata figures. While including numbers can be simply done with a local, the trick is to have them nicely formatted. I.e., to include commas in a larger number, or to have decimals rounded. Continue reading “Formatted numbers in figure (sub)headers”
Greek Letters in Stata Graphs
There is a rather easy way of including Greek letters in Stata figures.
Greek letters are written in the following way:
$latex \beta$ = {&beta} Continue reading “Greek Letters in Stata Graphs”
Stacked graphs in Stata
For plotting the relative importance of (e.g.) input shares, it can be useful to stack them in a figure. In my specific problem, I wanted to show the development of low-, medium-, and high-skilled labour inputs, relative to all labour inputs over time. Since the three shares obviously sum up to 1, I wanted to have a figure like this: Continue reading “Stacked graphs in Stata”


