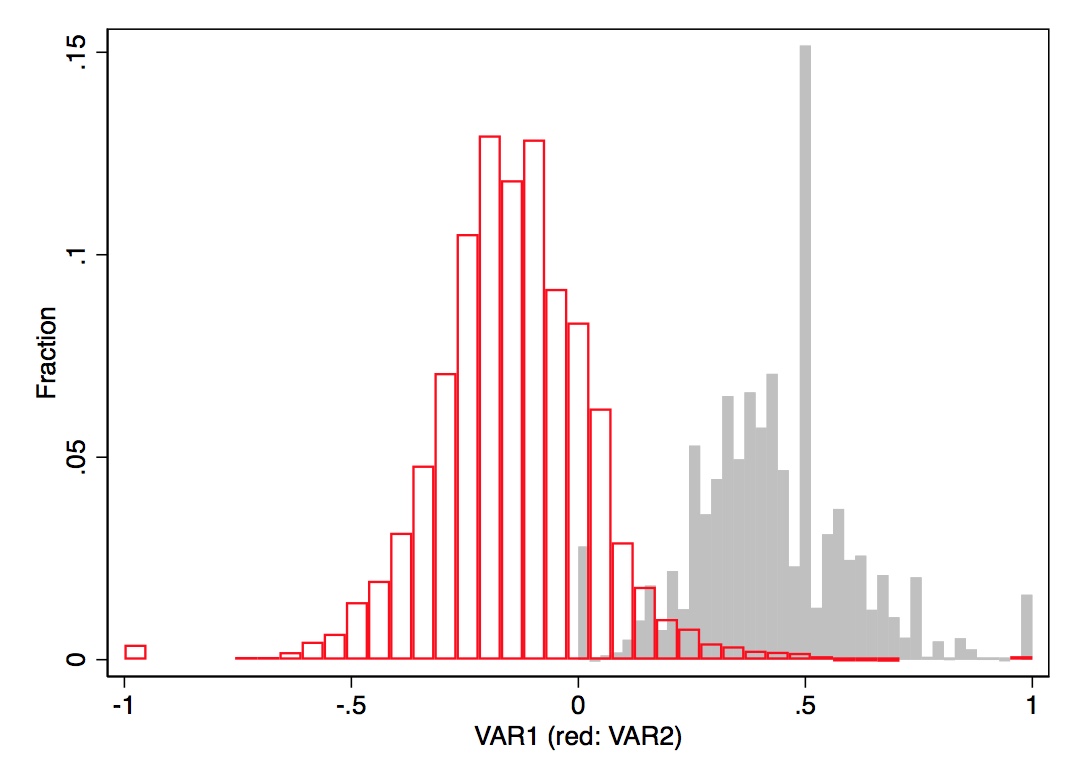
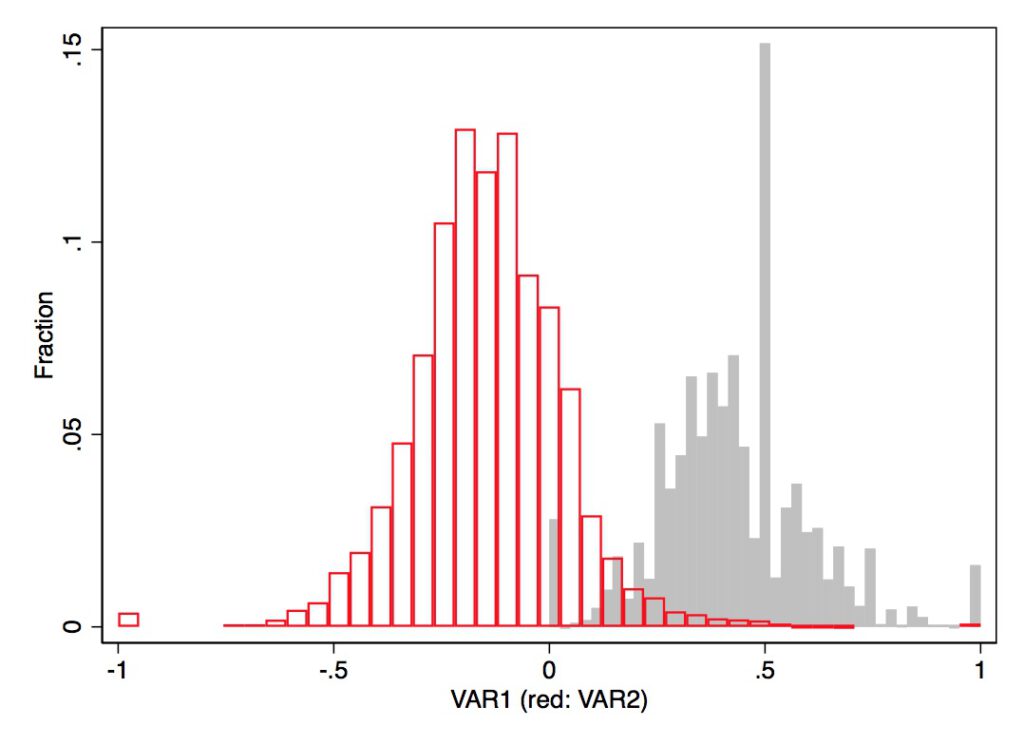
For analysing data and comparing distributions, I often want to overlay two histograms. Without further options, however, one distribution usually overlays the other and makes comparisons cumbersome. It is possible to set a few options to make the figure look nice.
twoway ///
(hist VAR1, frac lcolor(gs12) fcolor(gs12)) ///
(hist VAR2, frac fcolor(none) lcolor(red)) ///
, ///
legend(off) xtitle("VAR1 (red: VAR2)")
In this example, the bars of variable VAR2 have a red border and transparent body, whereas VAR1 is shown as in its default colors (both border and body is set to gs12).
Leave a Reply
You must be logged in to post a comment.