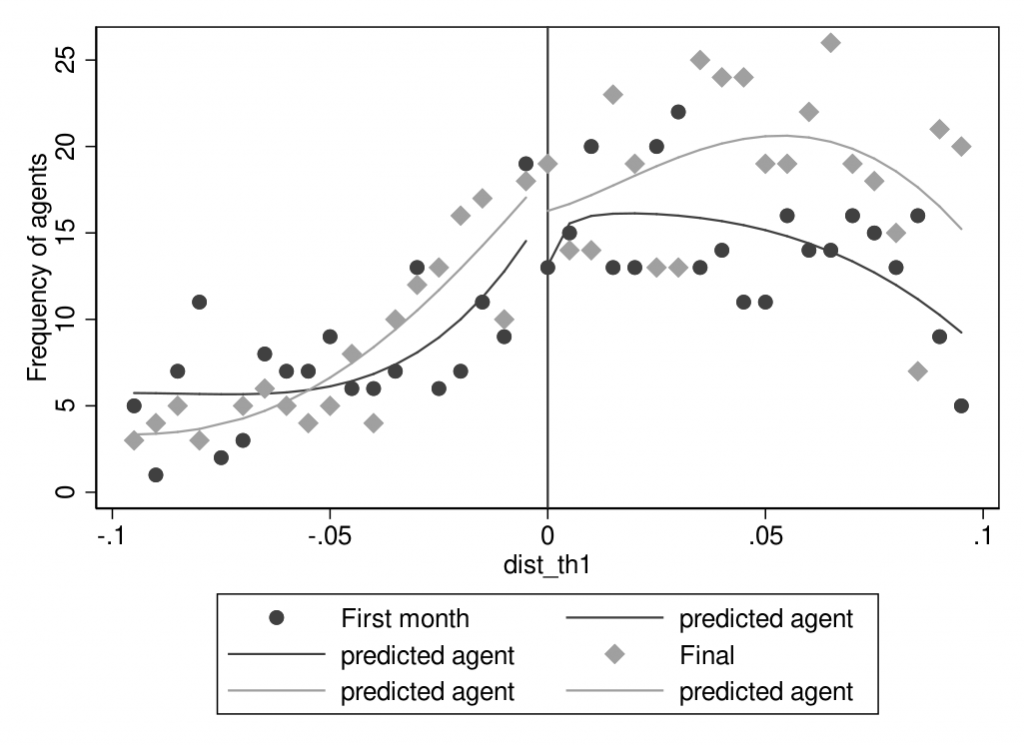
A great feature of Stata figures is that you can mix several plot types in one by using the twoway (...) (...) command. If you have several plots merged into one twoway graph and also want to add a legend, the legend might become a bit crowded. In the following example, legends are specified with the , legend(lab(1 "Scatter 1") lab (4 "Scatter 2")) option because I only wanted to mark the diamonds and circles in the legend:

(1 and 4 because the first and the fourth twoway element are the ones that I wanted to highlight in the legend)
How can I supress the other four elements of the twoway legend?
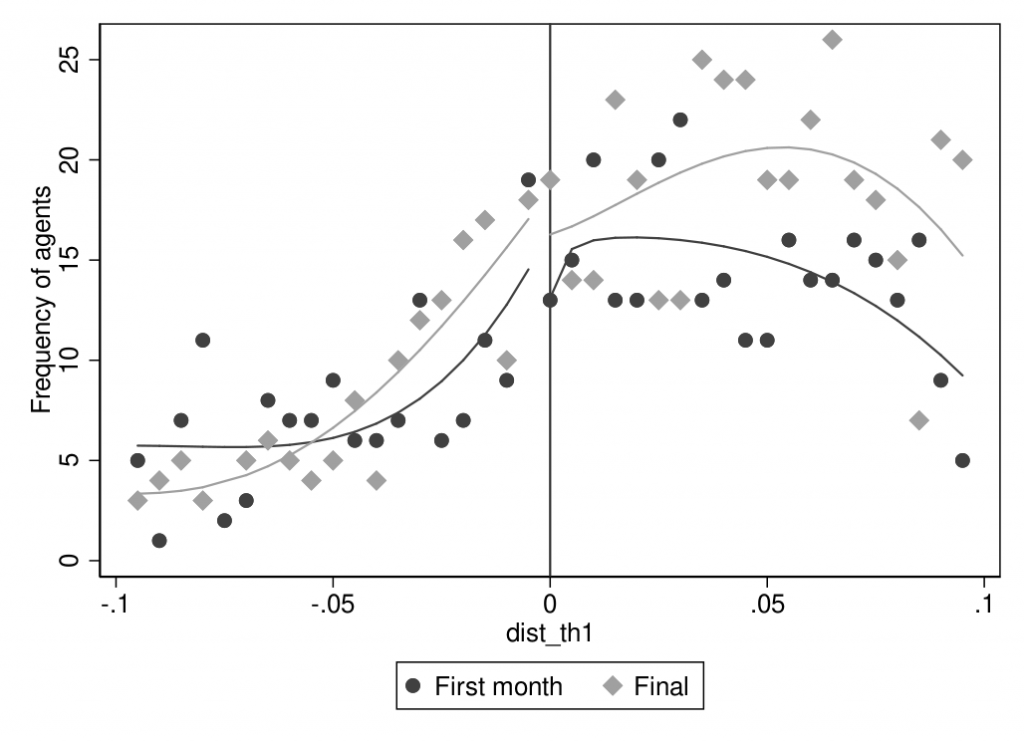
When using a slightly different variant of the legend option we can easily get rid of the unwanted legend elements:
, legend(order(1 "Scatter 1" 4 "Scatter 2"))
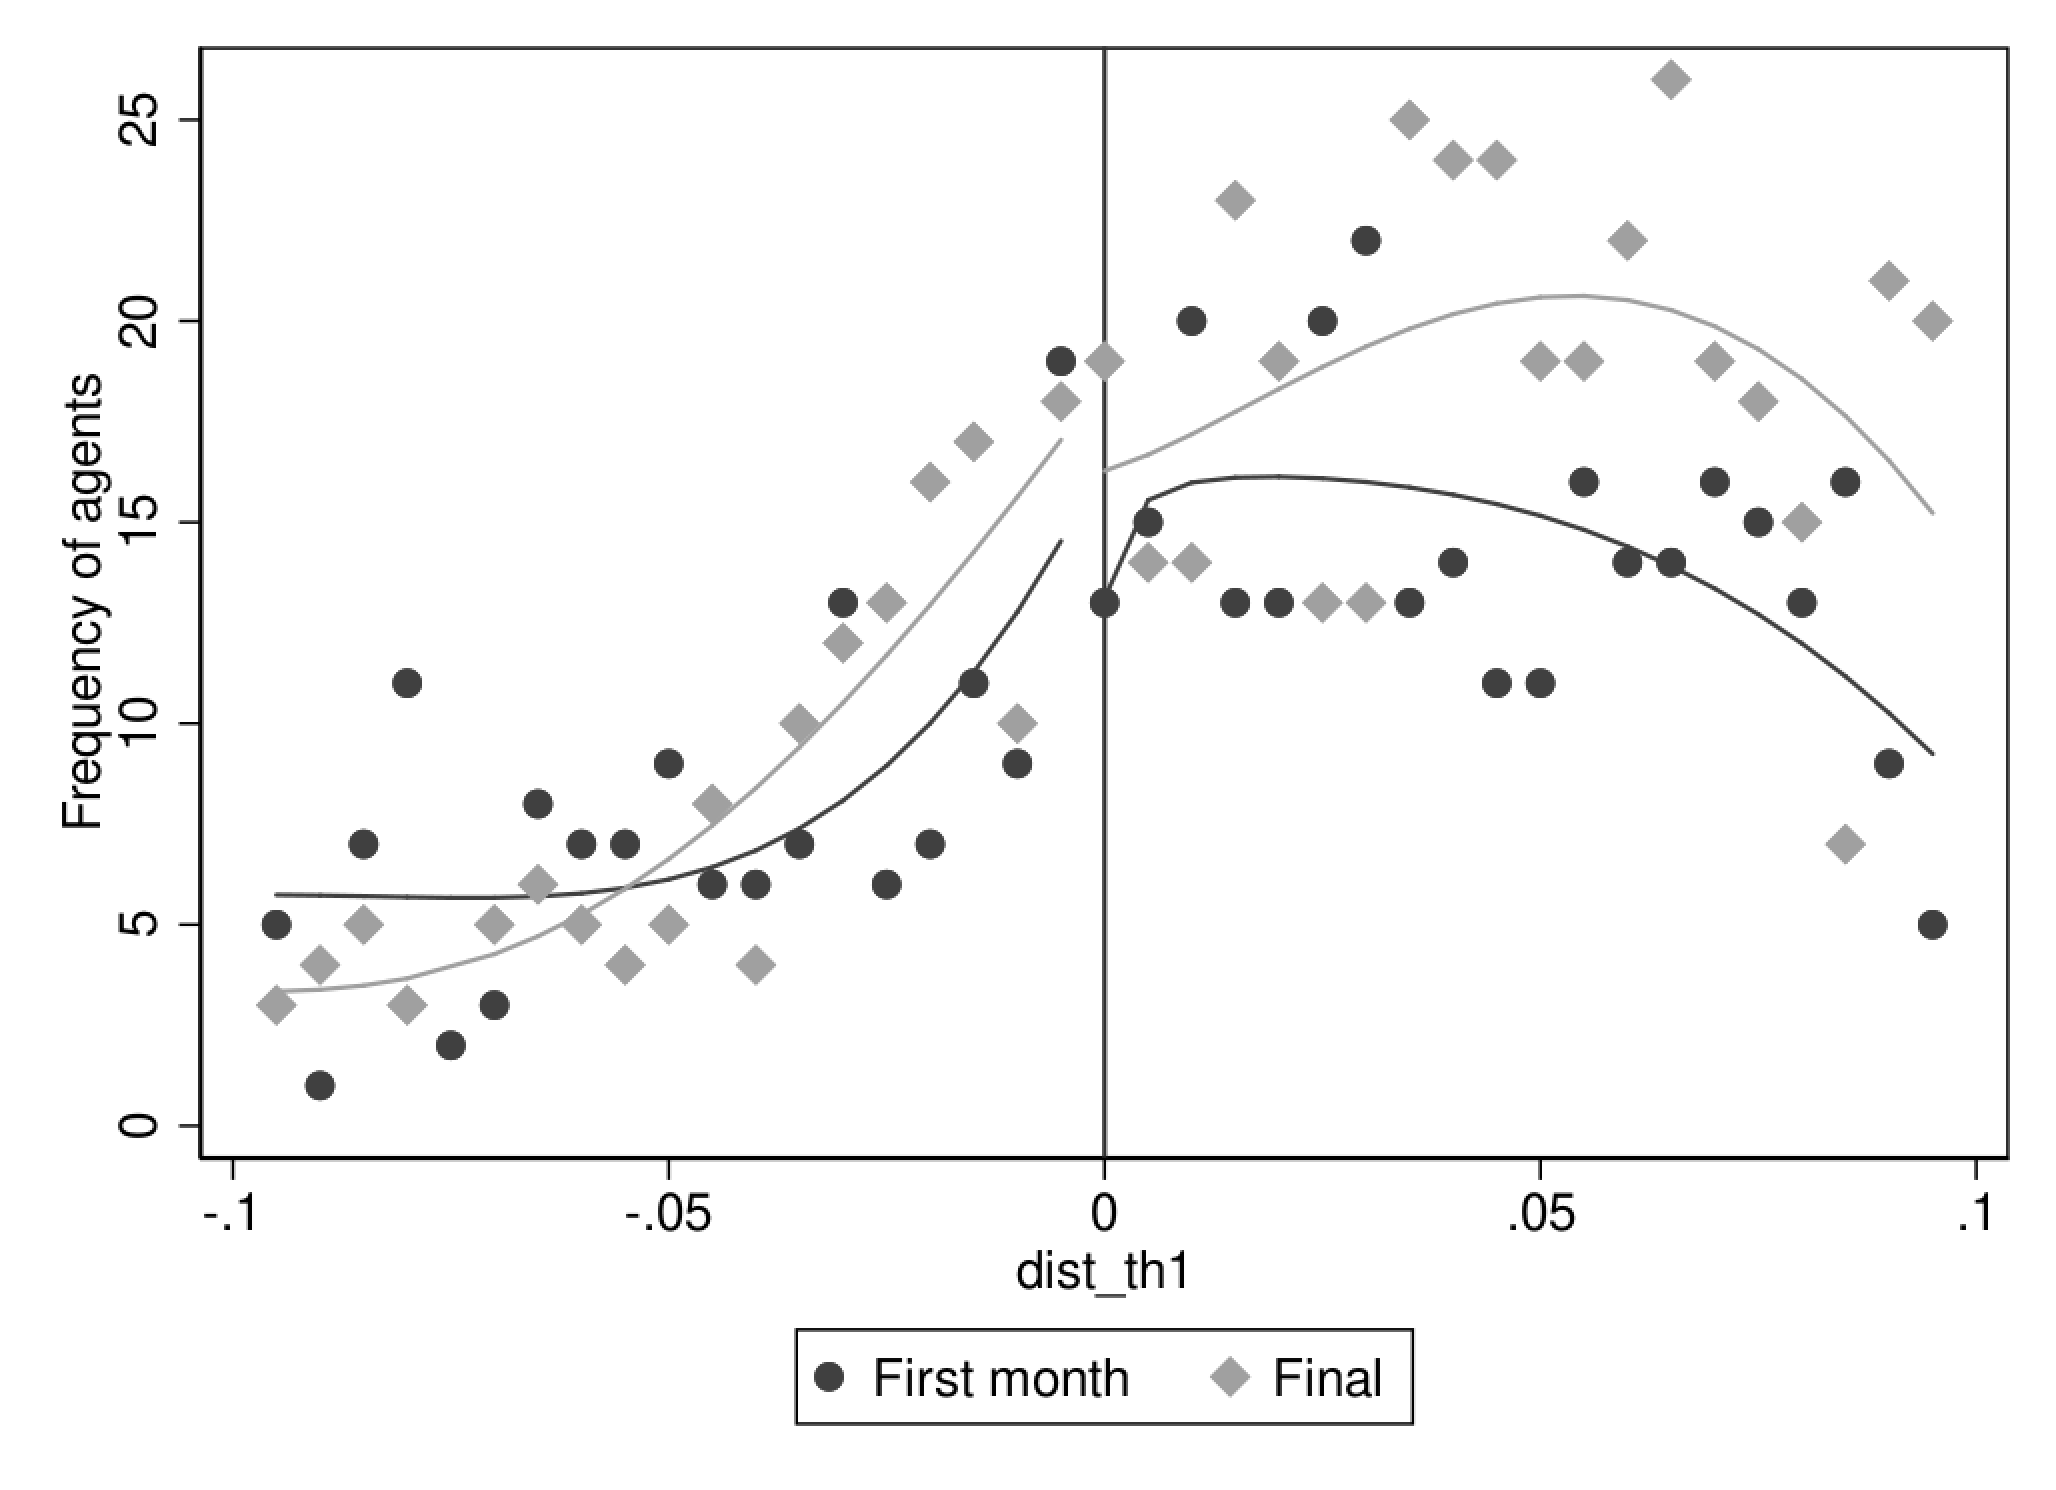
then results in the following and much better looking Stata figure:

hat tip: Statalist


Leave a Reply
You must be logged in to post a comment.