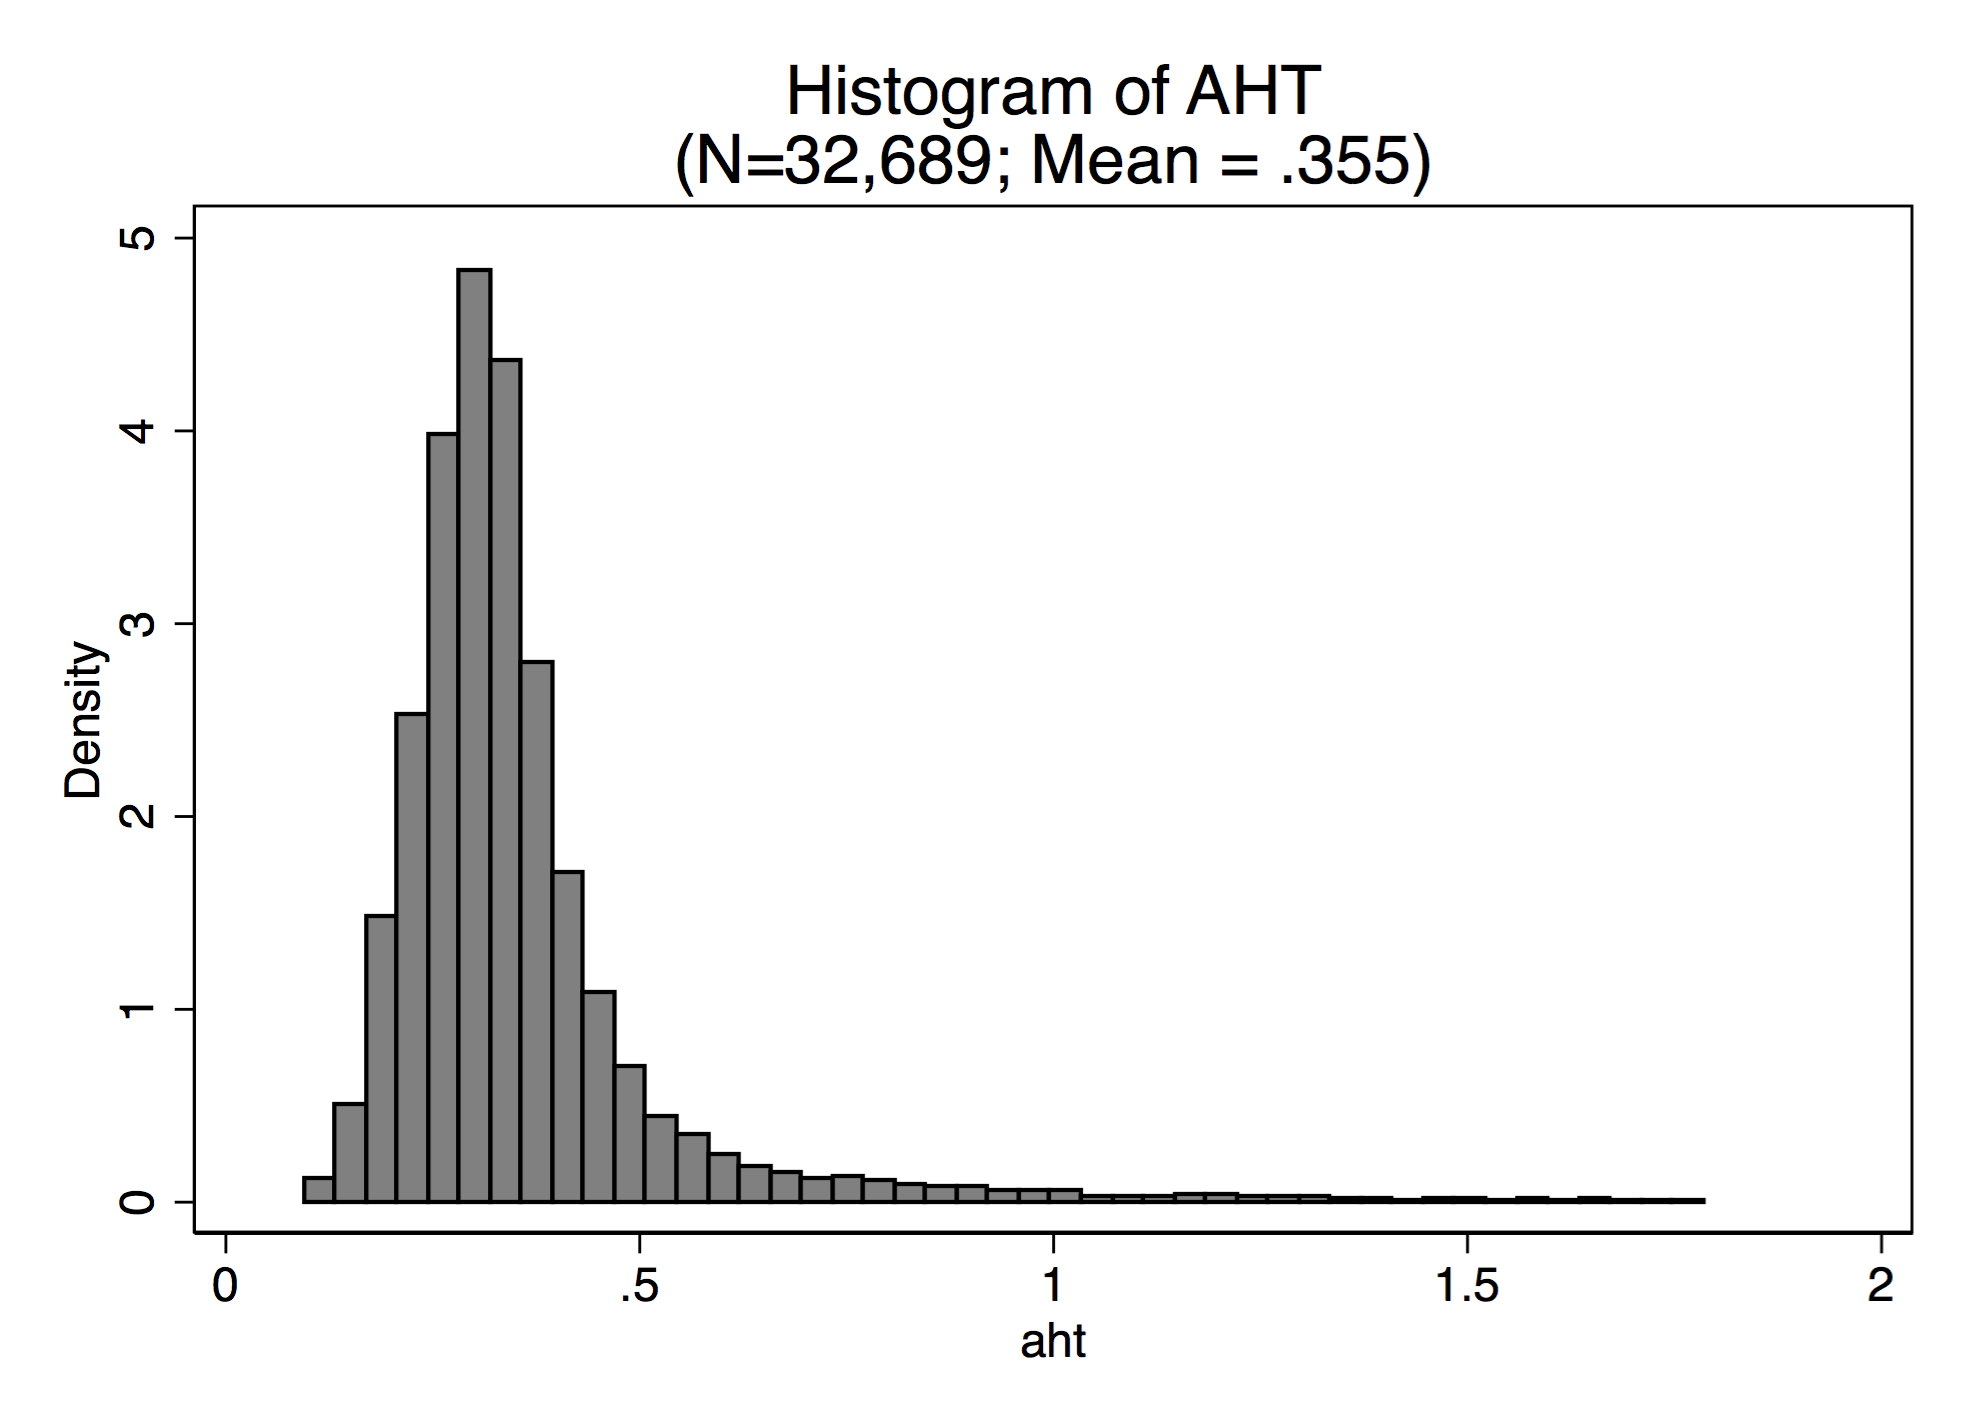
There is a very nice and simple trick to include numbers (such as: number of observations, R2s or any other number that can be saved to a local) in Stata figures. While including numbers can be simply done with a local, the trick is to have them nicely formatted. I.e., to include commas in a larger number, or to have decimals rounded.
In the example that follows, the variable of interest is “aht”, of which I want to produce a histogram with mean and underlying number of observations in a subtitle
quietly sum aht, det
local n = trim("`: display %11.0gc r(N)'")
local mean = trim("`: display %09.3g r(mean)'")
twoway (hist aht), title("Histogram of AHT" "(N=`n'; Mean = `mean')")
Note that the trim is optional, but helps to avoid unwanted spaces in the subtitle.
For more information on how to format output, also check
help format


Leave a Reply
You must be logged in to post a comment.